Read our climate feedbacks paper. The supplement is also available online.
There are many amplifying global warming feedback loops that significantly increase the warming due to greenhouse gas emissions. However, not all of these feedbacks are fully accounted for in current climate models. Thus, potential mitigation pathways based on these models could be overly optimistic and fail to sufficiently limit temperatures. A targeted expansion of research is needed to incorporate biologically-based feedbacks into Earth system models to guide climate policy objectives. Concurrently, policymakers must implement plans to minimize risks by greatly accelerating the reduction of greenhouse gas emissions.
To learn more about climate feedbacks
To learn more about climate feedbacks, please see our recent paper, Many risky feedback loops amplify the need for climate action, written by William J. Ripple, Christopher Wolf, Timothy M. Lenton, Jillian W. Gregg, Susan M. Natali, Philip B. Duffy, Johan Rockström, and Hans Joachim Schellnhuber, or one of these articles about the paper: Many risky feedback loops amplify the need for climate action: Nearly 30 dangerous feedback loops could permanently shift the Earth’s climate, scientists say (CNN), Scientists Examine Dangerous Global Warming 'Accelerators' (Inside Climate News). Feel free to also check out the materials on our website below, many of which are adapted from the paper's supplement.
To learn more about climate tipping points
To learn more about climate tipping points, please see this tipping points website and the article Climate tipping points — too risky to bet against.
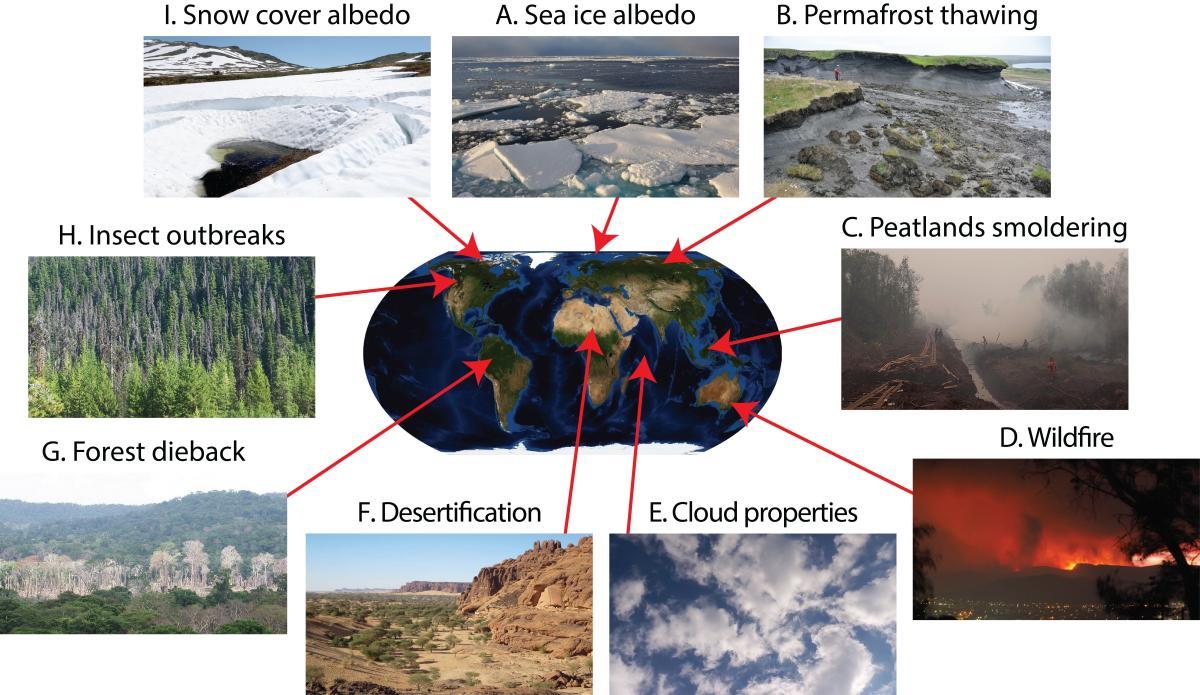
You are welcome to distribute our feedbacks infographic, which outlines several feedback loops:

One of the most important climate feedback loops involves sea ice and albedo (reflectance). To get a sense of how this loop operates, simply click the up arrow on "Temperature" and watch what happens to the three circles:
Feedback loops involving temperature can also indirectly affect each other. Clicking the up arrow on "Temperature" in this example shows how the wildfire and permafrost feedbacks can operate in parallel:
Here's an even more complex example, which includes the sea ice and soil carbon loops:
As described in this Carbon Brief article, this animation demonstrates a tipping point. The ball shows the current state of the system. The two basins correspond to potential states, with lower levels indicating greater stability. The graph on the right shows the movement of the ball over time. Credit: Chris Boulton.
Summary list of feedback loops. Loops are divided into three categories: physical (loop numbers 1-20), biological (loop numbers 21-41), and human or social (loop numbers 42-56). The rightmost column shows the loop direction (‘+’: reinforcing, ‘-’: balancing, ‘?’: uncertain); reinforcing loops are colored red. Feedback loops that involve potential tipping elements are marked with asterisks. Physical and biological feedbacks that are more likely to be at least partly included in some climate models, are marked with daggers (†). Many of these feedbacks will have significant effects on Earth’s climate, but others are more speculative and possibly negligible. Feedback impacts operate on time scales ranging from short (e.g., months/years) to very long (e.g., millennia); feedbacks we believe to be exceptionally slow are marked with double daggers (‡). Symbols indicate increasing (↑), decreasing (↓), and changing (Δ), and abbreviations correspond to circulation (circ.), concentration (conc.), temperature (temp.), atmospheric (atmos.), chemical (chem.), sequestration (seq.), biogenic volatile organic compounds (BVOCs), ozone (O3), evapotranspiration (ET), biological pump (bio.), and dimethyl sulfide (DMS). This table is adapted from the materials in the paper Many risky feedback loops amplify the need for climate action. See that paper for details, including complete loop descriptions, grouping order, limitations (e.g., overlapping loops and uncertain tipping elements), and selected references. For more information, including links to relevant articles, please see our feedback loop references page.
| Feedback | Effect of climate change | Effect on climate change | +/- |
|---|---|---|---|
20 physical (abiotic) feedback loops | |||
| 1. Planck† | ↑ Temperature | ↑ Heat loss (radiation) | - |
| 2. Water vapor† | ↑ Increasing water vapor content | ↑ Greenhouse effect | + |
| 3. Sea ice albedo*† | ↑ Sea ice melting or not forming | ↓ Albedo | + |
| 4. Ice sheets*†‡ | ↑ Glacier & ice sheet melting/instability | ↓ Albedo | + |
| 5. Sea level rise‡ | ↑ Sea levels | ↓ Albedo (↑ coastal submergence) | + |
| 6. Snow cover† | ↓ Snow cover | ↓ Albedo | + |
| 7. Clouds† | Δ Cloud distribution & optical properties | Δ Cloud albedo & greenhouse effect | + |
| 8. Dust† | Δ Dust aerosol abundance | Δ Albedo & greenhouse effect | ? |
| 9. Other aerosols† | Δ Atmos. aerosol conc. | Δ Albedo & greenhouse effect | ? |
| 10. Ocean stability | ↑ Ocean stratification | ↓ Carbon uptake by ocean | ? |
| 11. Ocean circ.* | ↓ Ocean circ. | Δ Surface temperature | ? |
| 12. Solubility pump† | ↑ Atmos. CO2 levels | ↓ CO2 absorption by ocean | + |
| 13. CH4 hydrates*‡ | ↑ CH4 hydrate dissociation rates | ↑ Release of CH4 into atmos. | + |
| 14. Lapse rate† | Δ Temp.-altitude relationships | ↓ Global mean temperature | - |
| 15. Ice-elevation‡ | ↓ Ice sheet/glacier elevation | ↑ Glacier & ice sheet melting, ↓ albedo | + |
| 16. Antarctic rainfall‡ | ↓ Ice sheet extent, ↑ precipitation | ↓ Albedo, ↑ deep ocean warming | + |
| 17. Sea ice growth | ↓ Sea ice thickness, ↓ insulation | ↑ Thin ice growth rate | - |
| 18. Ozone† | Δ Atmos. circ. | ↓ Tropical lower stratospheric ozone | ? |
| 19. Atmos. reactions† | Δ Atmos. chem. reaction rates | Δ Greenhouse effect | ? |
| 20. Chem. weathering‡ | ↑ Chemical weathering rates | ↑ CO2 taken out of atmosphere | - |
21 biological feedback loops | |||
| 21. Peatlands† | ↑ Drying and fire, ↓ Soil carbon | ↑ Release of CO2 into atmos. | + |
| 22. Wetlands† | ↑ Wetlands area (↑ precipitation) | ↑ CO2 seq., ↑ CH4 emissions | + |
| 23. Freshwater | ↑ Aquatic plant growth rates | ↑ CH4 emissions | + |
| 24. Forest dieback* | ↑ Amazon and other forest dieback | ↓ CO2 seq., Δ albedo | + |
| 25. Northern greening | ↑ Boreal forest area, Arctic vegetation | ↑ CO2 seq., ↓ albedo | + |
| 26. Insects | Δ Insect ranges and abundances | ↓ CO2 seq., Δ albedo | + |
| 27. Wildfire† | ↑ Fire activity in some regions | ↑ CO2 emissions, Δ albedo | + |
| 28. BVOCs† | Δ BVOC emission rates | ↓ Greenhouse effect, ↑ tropospheric O3 | - |
| 29. Soil carbon (other) | ↑ Loss of soil carbon | ↑ CO2 emissions | + |
| 30. Soil nitrous oxide† | Δ Soil microbial activity | ↑ Nitrous oxide emissions | + |
| 31. Permafrost*† | ↑ Permafrost thawing | ↑ CO2 and CH4 emissions | + |
| 32. Soil and plant ET | ↑ ET from soils and plants | ↓ Latent heat flux | + |
| 33. Microbes (other) | ↑ Microbial respiration rates | ↑ CO2 and CH4 emissions | + |
| 34. Plant stress | ↑ Thermal stress, ↑ droughts | ↑ Plant mortality, ↓ CO2 seq. | + |
| 35. Desertification | ↑ Desert area | ↓ CO2 seq., Δ albedo | + |
| 36. Sahara/Sahel greening* | ↑ Rainfall in Sahara and Sahel | ↑ CO2 seq. by vegetation | - |
| 37. CO2 fertilization | ↑ CO2 conc., ↑ NPP | ↑ Carbon uptake by vegetation | - |
| 38. Coastal productivity | ↑ Coastal ecosystem degradation | ↓ Coastal ecosystem carbon seq. | + |
| 39. Metabolic rates | ↑ Phytoplankton respiration rates | ↑ CO2 released into atmos. | + |
| 40. Ocean bio. | ↑ Ocean CO2, ↑ acidification, ↑ temp. | Δ Ocean carbon sink | ? |
| 41. Phytoplankton-DMS† | Δ Plankton DMS emissions | Δ Cloud albedo | ? |
15 human feedback loops | |||
| 42. Climate-related disasters | ↑ Fires, storms, flooding | ↑ Carbon costs for rebuilding | ? |
| 43. Human migration | ↑ Uninhabitable area | ↑ Migration and construbtion carbon costs | ? |
| 44. Human mobility | ↑ Movement (traveling) | ↑ CO2 emissions | + |
| 45. Transport routes | Δ Transport routes | Δ CO2 emissions | ? |
| 46. Energy demand | ↑ Global mean temperature | Δ Energy-related GHG emissions | ? |
| 47. Agriculture | Δ Crop yields, agricultural suitability | Δ CO2 emissions due to agriculture | ? |
| 48. Coral reefs | ↑ Coral die-off, ↓ fisheries | ↑ Food production carbon costs | + |
| 49. Freshwater | ↓ Freshwater availability | ↑ Desalination/migration CO2 emissions | + |
| 50. Mitigation | ↑ Sense of urgency | ↑ Mitigation efforts | - |
| 51. Policy paralysis | ↑ Magnitude of policy issue | Δ Difficulty to address climate change | + |
| 52. Economic growth | ↑ Permafrost thawing | ↑ CO2 and CH4 emissions | ? |
| 53. Economic disruption | ↑ Frequency of economic disruptions | ↓ Investment in mitigation | + |
| 54. Political disruption | ↑ Political upheaval | ↓ International cooperation | + |
| 55. Geopolitics | ↑ Unequal climate impacts | ↑ Difficulty of global cooperation | + |
| 56. Human conflict | ↑ Conflict (↓ resources) | ↑ Military GHG emissions | + |
Credits for all feedback loop photos are provided in Table S3 of the Supplemental Information of our One Earth paper
Climate Feedback News
In this section, we list recent climate feedback articles that may be of interest:
- Coverage of the study Many risky feedback loops amplify the need for climate action: Nearly 30 dangerous feedback loops could permanently shift the Earth’s climate, scientists say (CNN), Scientists Examine Dangerous Global Warming 'Accelerators' (Inside Climate News)
- 'Firmageddon': Researchers find 1.1 million acres of dead trees in Oregon - This article describes a massive-scale die-off of fir trees in Oregon, which is partly due to climate change increasing drought and heat wave severity. This event is an example of the forest dieback climate feedback loop because the dead trees are no longer able to sequester carbon.
If you'd like to suggest that we add a new feedback loop to our table or a new article to our references list, please use our Contact Form (select the "Feedback Loops Project" category). Any other comments or suggestions are also welcome.